August 2, 2005
By Stan Deyo
Home https://standeyo.com
This RED ALERT is the first of its kind I've ever made in the 11 years of studying seismic event indicators. It is so huge that I almost can't believe my eyes. The importance and severity of this has impressed me more significantly than when I predicted and warned about the coming December 26, 2004 Indonesian events beginning December 22.
For the last 6 days, I've seen indications of a large number of earthquake pressures building across a 2,000-mile long arc in the North Pacific. At first, I thought these indications were a result of large storms so I disregarded them. Until this afternoon when a listener (thanks Dan) heard my radio broadcast and emailed information to me, I wasn't able to explain the cause of this discovery.
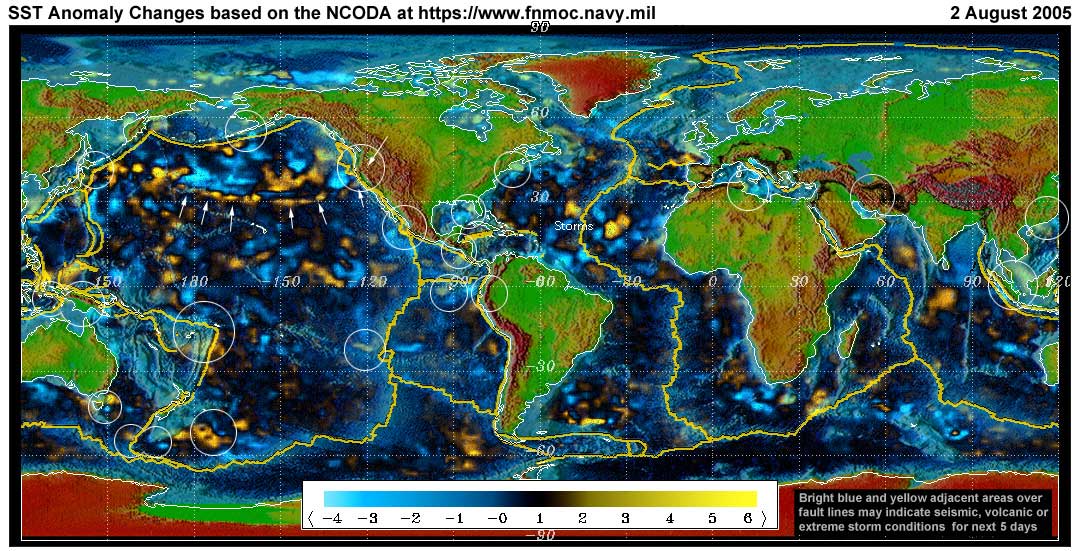
Below you will see white arrows pointing at this arc of signals that have appeared over the last 6 days. They are heading straight into Mendocino, CA to the area where 3 tectonic plates meet. Notice on today's image and for 5 days preceding, the clear definition of this phenomenon. It is occurring all along what is called the Mendocino Fault Zone or Ridge. This is a place where the sea floor rises up to within 1,203 yards of sea surface 168 miles west of Mendocino, CA. It's been the subject of a great many technical papers in the world of geology and seismicity.
Today, news came to us of the collapse of the resurgent dome at Mt. St. Helens. There have been a number of small earthquakes in the range of 3.0 over the last 2 weeks at Mt. St. Helens. Scientists monitoring this claim to be a loss to explain the cause.
Depending on how large and how many seismic events release along the Mendocino Ridge in the near future, where it connects to California could trigger releases not only to the San Andreas Fault map (and San Andreas photo), but also the Juan De Fuca Plate. Juan de Fuca is the only major zone on the great Ring of Fire around the Pacific that hasn't seen a major seismic event in the last 50 years. I don't need to explain the implications of such an event. When this occurs, it will be one of the greatest catastrophes in America history.
HOWEVER, since I have never seen an event of this size in the making, I don't know if it will back off and come back again several times before releasing. All I am sure of is that it's a unique event in my 9 years of monitoring these seismic indicators.
At the very least, you should be sure your emergency stocks of food, water and medicines are what they should be for such an event. We will continue to monitor this situation and are already warning on radio broadcasts. It has the potential to produce enormous tidal waves throughout the Pacific Basin.
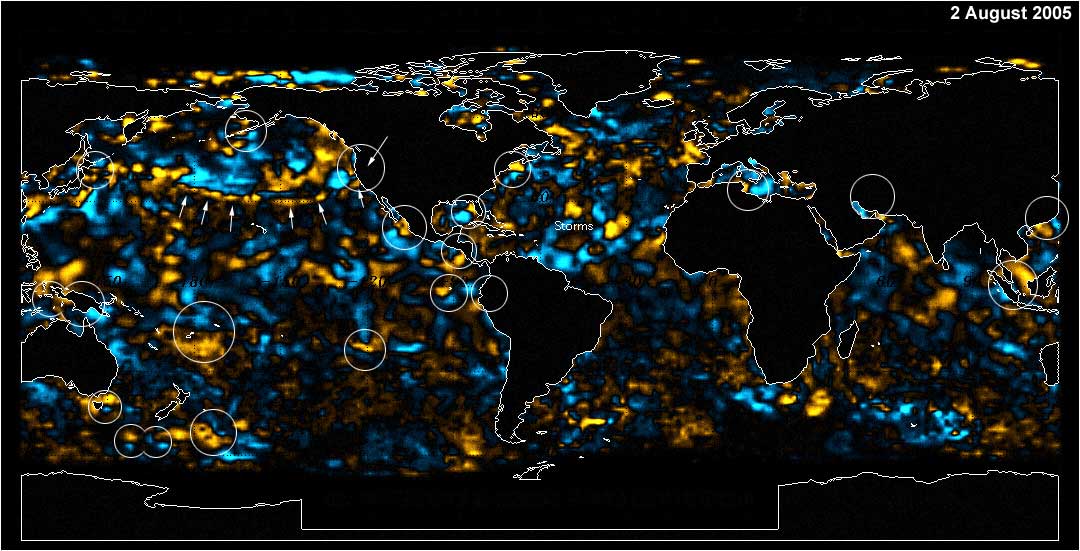
Stan's analysis shows areas of possible earthquake or volcanic activity, or extreme storm conditions for the next 1 to 5 days. Pay particular attention to areas marked by white circles. The continuous yellow line denotes plate tectonic boundaries as well as the Ring of Fire. Go to the raw data map where it is easier to see the areas of concern. Go to Stan's earthquake map archives.
DEYO NOTES: For earthquake maps, see the USGS "shake maps" (click anywhere on the global map for a closer view). For quakes USGS may not list, go to the European-Mediterranean Seismological Center's map and scroll to the bottom of the page for a global view. You can compare these maps for the next 5 days to Stan's NCODA maps, to see the hits of his seismic target zones (white circles).
Earthquake lists can viewed at EMCS and at USGS.
Ecuador's Geophysics Institute at the National Polytechnic School, does not list quakes on a daily basis as does the USGS and other entities, but when there are significant events, they post them in PDFs.