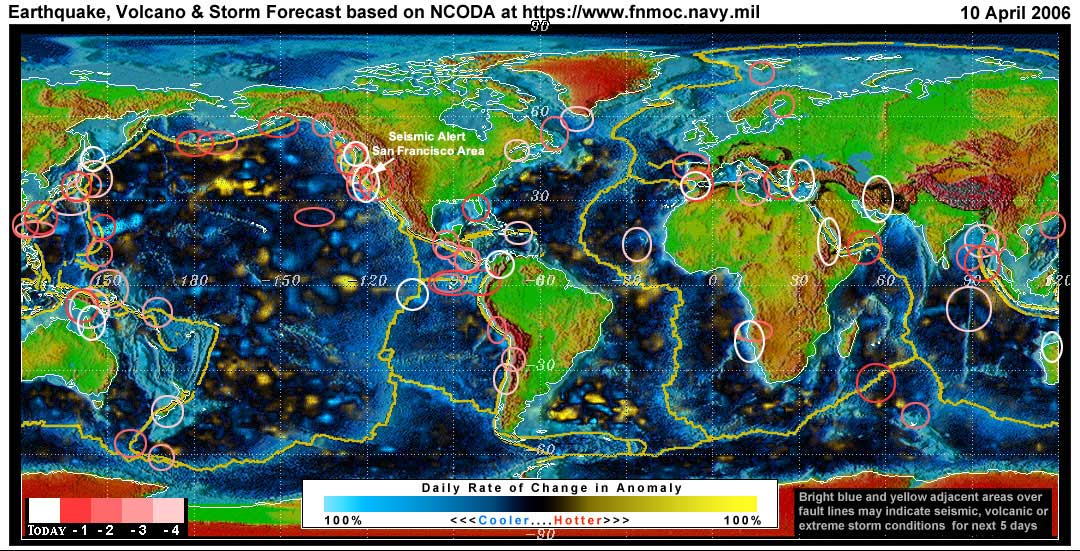
Expected Global Earthquake, Volcanic or Storm Activity for the Next 1 to 5 Days;
(Except the SW Pacific and Indonesian Ocean Which Have a 1 to 10 Day Window)
Are YOU Prepared?
April 10, 2006
By Stan Deyo
Home https://standeyo.com
Bay of Bengal Region: The major quake threat continues for another three days.
USA: The last 7 days have shown seismic signals above and below and upon the San Francisco region. Today the signal is VERY strong near the south side of SF Bay. If the SF region sees an event, the seismic stresses of the last 7 days indicate a series of other events may occur from SF to Alaska along the west coast of North America.
Iran: Large seismic event building on the Eastern side of Iran... (hm.m..m...m wonder what is causing this....) It has been building for the last 7 days as well.
Central America: See the circles indicated. Last 7 days have shown stresses building in this region as well.
Other circled regions: As shown. —Stan Deyo
For an explanation of how these maps are produced, please see this area.
Stan's analysis shows areas of possible earthquake or volcanic activity, or extreme storm conditions for the next 1 to 5 days. Pay particular attention to areas marked by white circles. The continuous yellow line denotes plate tectonic boundaries as well as the Ring of Fire. Go to the raw data map where it is easier to see the areas of concern. Go to Stan's earthquake map archives.
NEW FEATURE: The circles in varying shades of red are quake prediction zones Stan made from 1 to 4 days ago - with dark red being 1 day ago and the lightest red being 4 days ago. White circles are Stan's prediction zones for today. Tomorrow these white circles will become dark red and will get lighter as each day passes until they are removed.
These circles indicate the stresses in an area and warn of a probable quake in an area. The areas do not always convert to a quake. When a quake does occur and has been in or fairly close to the outer radius of a circle I have drawn over a given fault zone area then it is counted as a "hit". When stress signals go into a large land mass I have to estimate the radius of the circle and the vector to the nearest major fault on the land mass.
DEYO NOTES: For earthquake maps, see the USGS "shake maps" (click anywhere on the global map for a closer view). For quakes USGS may not list, go to the European-Mediterranean Seismological Center's map and scroll to the bottom of the page for a global view. You can compare these maps for the next 5 days to Stan's NCODA maps, to see the hits of his seismic target zones (white circles).
Earthquake lists can viewed at EMCS and at USGS.
Ecuador's Geophysics Institute at the National Polytechnic School, does not list quakes on a daily basis as does the USGS and other entities, but when there are significant events, they post them in PDFs.
Disclaimer: Some of the forecast stress areas can be in error up to 30% due to cloud cover variations and false signals from buoys.