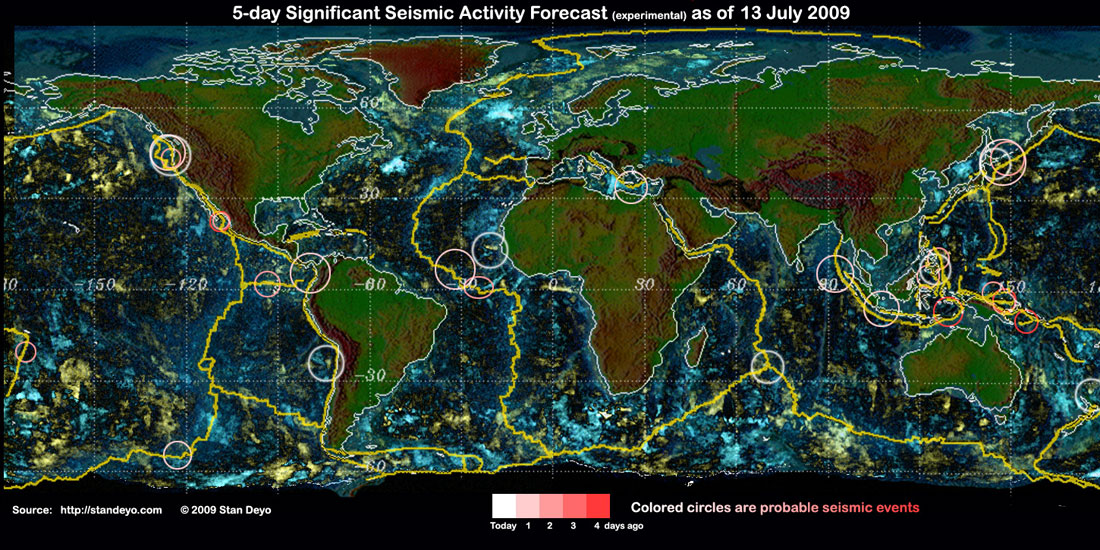
Expected Global Earthquake, Volcanic or
Storm Activity for the Next 1 to 5 Days
(Experimental); Except the SW Pacific and Indonesian
Ocean Which Have a 1 to 10 Day Window
July 13, 2009
By Stan Deyo
Go to Earth Changes News
Many people have visited our website and checked my earthquake (shaker) forecast over the last 13 years – at least until 12 November 2006 when I lost access to the SST NCODA Anomaly maps, which the US Navy's FNMOC at Monterey allowed the public to use.
It has taken me this long to build a new database from other sources so that I could again make global seismic forecasts. Special thanks to Gary W. for sharing this SST map source. Over the past two years, people pointed me to other sites, but the maps didn't contain sufficient data.
They too, didn't produce some of the need information, but after contacting them, they agreed to generate the needed anomaly maps from which I develop the quake forecasts. I'm not going to make known what company provides these maps since after FNMOC stopped their data, access to other maps was blocked or the maps disappeared altogether.
Due to the way in which the data are collected, it has become more difficult for me to see the "butterfly" pattern which used to signal major seismic events along the various coastlines of the world. However, even though I might miss a few smaller ones, until I have mastered the new analysis method I have decided to post these "Shake Alerts" when I see significant stresses building in areas which could cause damage to population centers.
Remember: This new forecast map analysis is still experimental and should not be considered 100% efficient. —Stan Deyo
Stan's analysis shows areas of possible earthquake or volcanic activity, or extreme storm conditions for the next 1 to 5 days. Pay particular attention to areas marked by white circles. The continuous yellow line denotes plate tectonic boundaries as well as the Ring of Fire. Go to Stan's earthquake map archives.
Earthquake lists can viewed at EMCS and at USGS.
Disclaimer: Some of the forecast stress areas can be in error up to 30% due to cloud cover variations and false signals from buoys.